An interactive map of Google Cloud's 2026 AI tools: what engineers code with, the platform they build on, and when to reach for each.
- Shipped
- Built with
- claude-code, claude-opus-5-5
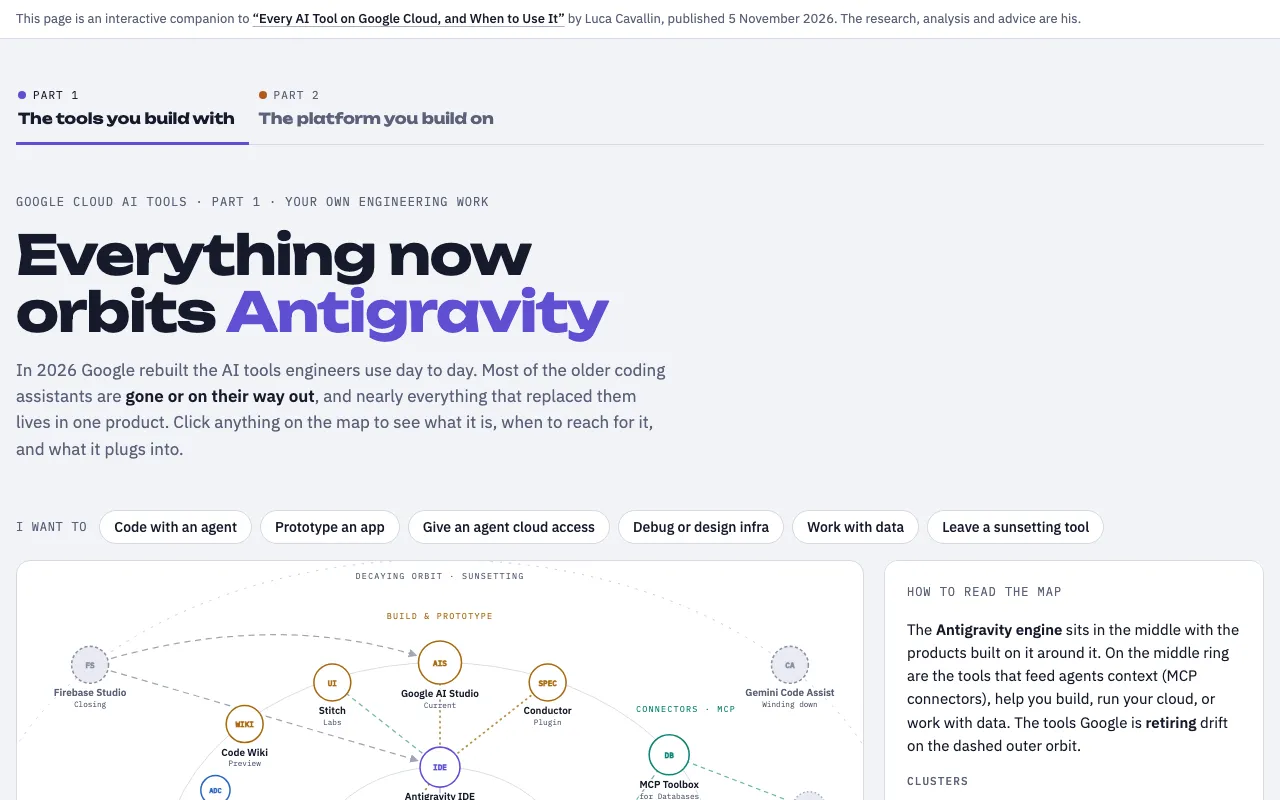
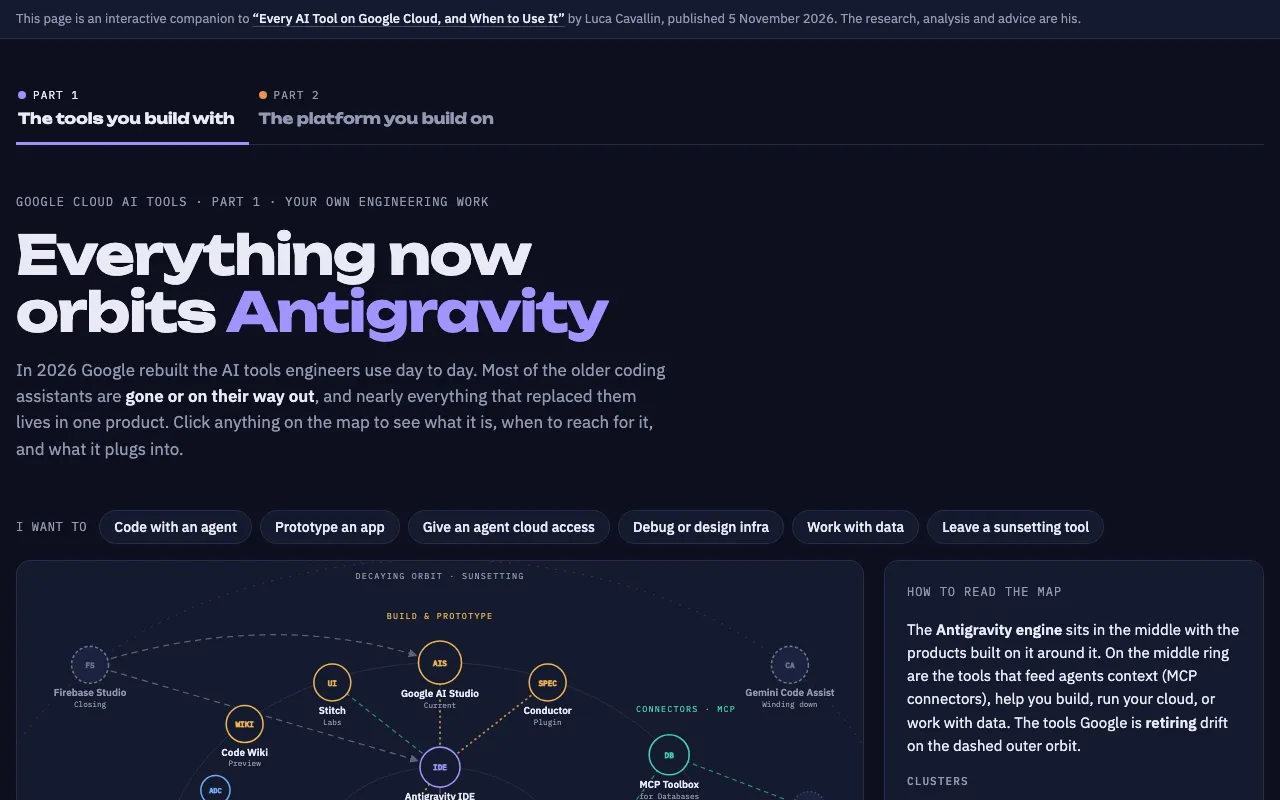
This is an interactive companion to Luca Cavallin’s article “Every AI Tool on Google Cloud, and When to Use It”, published 5 November 2026. The research, analysis and advice are his. I turned it into something you can click around in.
Google renamed, merged and retired a lot of its AI products in 2026, and the article is the clearest map of where things landed that I’ve found. It’s long and dense, though, and the relationships between the tools matter as much as the tools themselves. So the companion has two views:
- Part 1, the tools you build with: an orbital map with Antigravity at the center, the build, connector (MCP), ops and data tools around it, and the sunsetting tools drifting on the outer ring. There’s also a sunset clock with the shutdown dates.
- Part 2, the platform you build on: a cross-section of Gemini Enterprise Agent Platform (what Vertex AI became), from what you ship at the top down to the hardware, with guardrails down the side. It also has the article’s cost ladder and a decoder for the renames.
Click any tool to see what it is, when to use it, and what it connects to.
How it was built
I built it with Claude Code and Claude Opus 5.5 in a handful of prompts, starting with Part 1 only. Part 2 came after I asked where Gemini Enterprise Agent Platform fit on the first map. The answer was that it’s the layer underneath everything else, so it got its own visualization and its own color scheme. The page is a single HTML file with inline SVG and plain JavaScript, published as a Claude artifact.
What I learned
A single diagram couldn’t hold the whole article. The tools engineers use every day and the platform they build on have different shapes: one is a hub with satellites, the other is a stack of layers. They read much better as two connected views than as one crowded one.
Prompts
1. Read the source
Are you able to read the contents of this URL? https://www.lucavallin.com/blog/google-cloud-ai-tooling-for-engineers
The whole project is built on Luca Cavallin’s article, so the first step was to check that Claude could read it in full.
2. The seed
Ok, can you just for part 1 create an interactive visual in HTML that shows the connections between these tools for engineering work, and explains why you’d use each one? I would like something with a nice design so it’s engaging to learn the content. HTML plus JavaScript, and any necessary visualization libraries, should be good enough for this.
Scoping it to Part 1 kept the first version focused. Asking for the connections between the tools, not just a list of them, is what led to the orbital map.
3. The question that changed the scope
Wow, this looks great. One question: where does “Gemini Enterprise Agent Platform” (“Agent Platform”) sit in this visualization? Is it possible to incorporate it, or does it require a separate visualization?
Agent Platform didn’t fit on the tools map, because it’s the layer everything else runs on. This question is what turned the project into two parts.
4. Part 2
Ok, can you keep this Part 1 the same, and then add another visualization for Part 2? It would be useful to use a slightly different color scheme for Part 2 so it’s obvious that it’s the platform you build on, while Part 1 is the tools you use to build.
The different color scheme makes it obvious which view you’re in. Part 2 became a cross-section from what you ship down to the hardware, instead of a second orbit.
5. Credit
Can you add a banner at the top of each page that links to the original article “Every AI Tool on Google Cloud, and When to Use It” and gives credit to Luca Cavallin for his original work?
The research is his, so the credit sits at the top of every view, not only in the footer.